
はじめに
完全に私的な備忘録です.
LaTeXの作図ツールをtikzを使ってレポートを作成しました.
tikzを使うことにより,画像を張り付ける手間がなくなり,さらに図も綺麗に描けます.
しっかりとした使用方法は理解してないのですが,とりあえず思ったものが綺麗にかけて満足です.
コードと出力結果
コードと出力をペタペタしていきます.
まずは以下をブリアンブルに記載.
(すごい余談なのですが,このブリアンブルって英語で何というんですかね.スペルもわかんない)
\usepackage{tikz} % tikzパッケージを読み込む
コードと出力結果です.(某業界ではおなじみの図表達です)
\begin{figure}[tbp]
\begin{minipage}[b]{0.49\columnwidth}
\centering
\begin{tikzpicture}[samples=100, very thick]
% \draw (0,0) node[below left]{O}; % 原点、0でも、above, below, left, rightで位置指定
% 位置指定はanchor=north, south, east, westでも可能
\draw[thick, ->] (-0.25,0)--(6.5,0) node[right] {Density}; % x軸、[->]で矢印、他に[-stealth]等
\draw[thick, ->] (0,-0.5)--(0,4.1) node[above] {Flow}; % y軸
\draw[thick, -] (0,0)--(2,4);
\draw[thick, -] (2,4)--(6,0);
%
\coordinate [label=above right:{\textcircled{\scriptsize 0}(0,0)}] (S0) at (0,0);
\coordinate [label=right:{\textcircled{\scriptsize 1}(30,3000)}] (S1) at (1.5,3);
\coordinate [label=right:{\textcircled{\scriptsize 2}(80,2000)}] (S2) at (4,2);
\coordinate [label=right:{\textcircled{\scriptsize 3}(20,2000)}] (S3) at (1,2);
\coordinate [label=right:{\textcircled{\scriptsize 4}(100,1000)}] (S4) at (5,1);
\coordinate [label=right:{\textcircled{\scriptsize 5}(10,1000)}] (S5) at (0.5,1);
%
\fill (S0) circle (3pt);
\fill (S1) circle (3pt);
\fill (S2) circle (3pt);
\fill (S3) circle (3pt);
\fill (S4) circle (3pt);
\fill (S5) circle (3pt);
\end{tikzpicture}
\caption{QK図}
\label{QK図}
\end{minipage}
\begin{minipage}[b]{0.49\columnwidth}
\centering
\begin{tikzpicture}[samples=100, very thick]
\draw[thick, -] (0,0)--(0,7);
\draw[thick, -] (2,0)--(2,7);
%
\draw[thick, ->] (2.5,0)--(2.5,7) node[above] {進行方向};
%
\draw[thick, -] (2.1,6)--(-0.1,6) node[left] {地点C};
\draw[dashed, -] (2.1,5)--(-0.1,5) node[left] {};
\draw[thick, -] (2.1,3)--(-0.1,3) node[left] {地点B};
\draw[dashed, -] (2.1,2)--(-0.1,2) node[left] {};
\draw[dashed, -, white] (2.1,1)--(-0.1,1) node[left,black] {地点A};
%
\coordinate [label=center:{\textcircled{\scriptsize 5}}] (S5) at (1,6.5);
\coordinate [label=center:{\textcircled{\scriptsize 4}}] (S4) at (1,5.5);
\coordinate [label=center:{\textcircled{\scriptsize 3}}] (S3) at (1,4);
\coordinate [label=center:{\textcircled{\scriptsize 2}}] (S2) at (1,2.5);
\coordinate [label=left:{\textcircled{\scriptsize 1}}] (S1) at (0.6,1);
\coordinate [label=right:{\textcircled{\scriptsize 0}}] (S0) at (1.4,1);
%
\fill (S5) circle (0pt);
\fill (S4) circle (0pt);
\fill (S3) circle (0pt);
\fill (S2) circle (0pt);
\fill (S1) circle (0pt);
\fill (S0) circle (0pt);
%
\draw[thick, ->] (S1)--(S0);
\end{tikzpicture}
\caption{道路}
\label{道路}
\end{minipage}
\end{figure}

\begin{figure}[tbp]
\begin{tikzpicture}[samples=100, very thick]
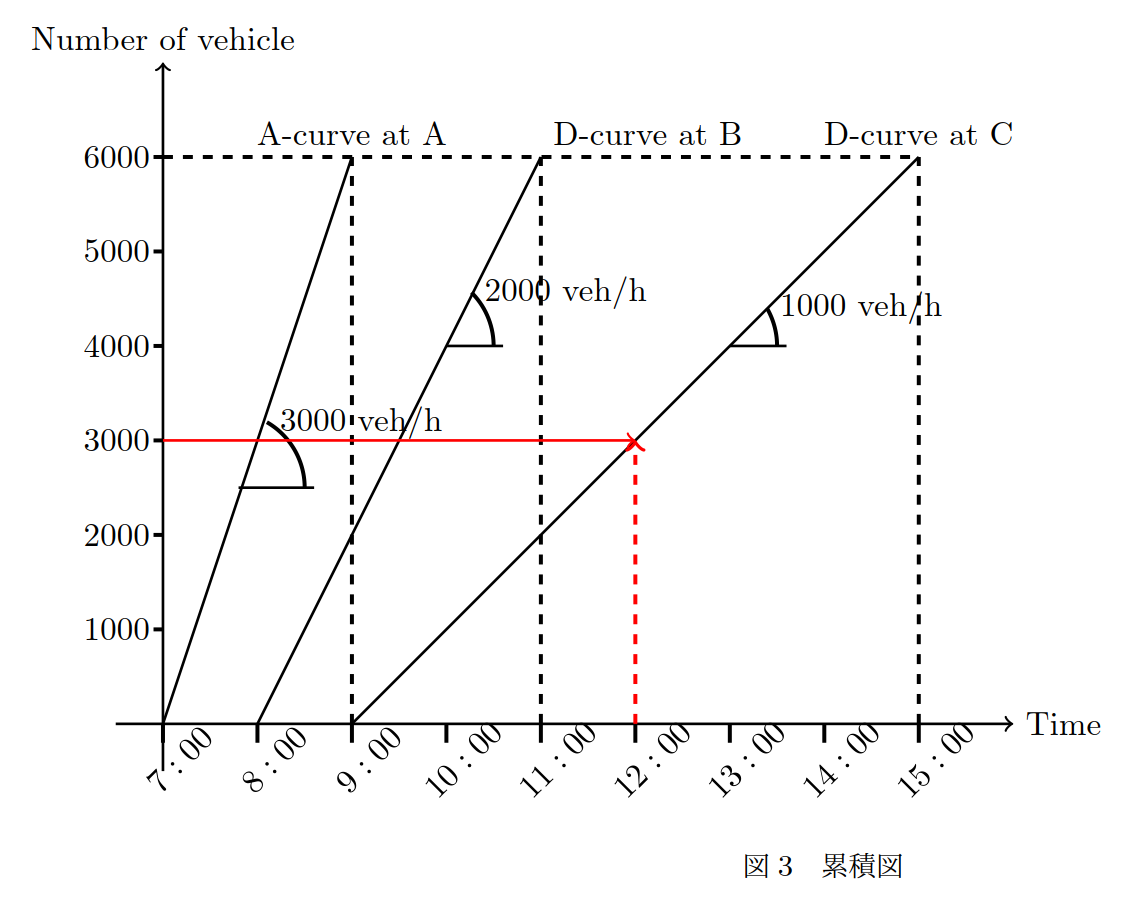
\draw[thick, ->] (7-0.5,0)--(16,0) node[right] {Time}; % x軸、[->]で矢印、他に[-stealth]等
\draw[thick, ->] (7,0-0.5)--(7,7) node[above] {Number of vehicle}; % y軸
%
\foreach \x in {7,8,9,10,11,12,13,14,15}
\draw (\x,0) -- (\x,-0.2) node[anchor=north, rotate=45] {$\x:00$};
\foreach \y in {1,2,3,4,5,6}
\draw (6.9,\y) -- (7,\y) node[anchor=east] {$\y 000$};
%
\draw[thick, -] (7,0)--(9,6) node[above] {A-curve at A};
\draw[dashed, -] (9,0)--(9,6);
%角度
\coordinate (A1) at (8.5, 2.5){};
\draw[thick, -] (8.6,2.5)--(7.8,2.5);
\path[draw] (A1) arc[radius=0.8, start angle=0, end angle=60] node[right] {3000 veh/h};
%
\draw[thick, -] (8,0-0)--(11,6) node[above right] {D-curve at B};
\draw[dashed, -] (11,0)--(11,6);
\coordinate (B1) at (10.5, 4){};
%角度
\draw[thick, -] (10.6,4)--(10,4);
\path[draw] (B1) arc[radius=0.8, start angle=0, end angle=45] node[right] {2000 veh/h};
%
\draw[thick, -] (9,0-0)--(15,6) node[above] {D-curve at C};
\draw[dashed, -] (15,0)--(15,6);
\draw[dashed, -] (7,6)--(15,6);
%角度
\coordinate (C1) at (13.5, 4){};
\draw[thick, -] (13.6,4)--(13,4);
\path[draw] (C1) arc[radius=0.8, start angle=0, end angle=30] node[right] {1000 veh/h};
%
%
\draw[thick, ->, red] (7,3)--(12,3);
\draw[dashed, ->, red] (12,0)--(12,3);
\end{tikzpicture}
\caption{累積図}
\label{累積図}
\end{figure}

\begin{figure}[tbp]
\begin{tikzpicture}[samples=100, very thick]
\begin{scope}[xscale=1.5, yscale=1.5]
\draw[thick, ->] (7-0.5, -0.5)--(16, -0.5) node[right] {Time};
\draw[dashed, -] (15, 0)--(7,0) node[left] {A};
\draw[dashed, -] (15, 2)--(7,2) node[left] {B};
\draw[dashed, -] (15, 4)--(7,4) node[left] {C};
\draw[thick, ->] (7,0-0.5)--(7,4.5) node[above] {Space}; % y軸
%
\foreach \x in {7,8,9,10,11,12,13,14,15}
\draw (\x,-0.5) -- (\x,-0.7) node[anchor=north, rotate=45] {$\x:00$};
%
%
\coordinate [label=above right:{P0}] (P0) at (7, 0);
\coordinate [label=above left:{P1}] (P1) at (8, 2);
\coordinate [label=above left:{P2}] (P2) at (9, 4);
\coordinate [label=above left:{P3}] (P3) at (9, 0);
\coordinate [label=below right:{P4}(9:40)] (P4) at (29/3, 4/3);
\coordinate [label=above right:{P5}(11:00)] (P5) at (11, 2);
\coordinate [label=below right:{P6}(11:40)] (P6) at (35/3, 10/3);
\coordinate [label=above left:{P7}(15:00)] (P7) at (15, 4);
%
\fill (P0) circle (1pt);
\fill (P1) circle (1pt);
\fill (P2) circle (1pt);
\fill (P3) circle (1pt);
\fill (P4) circle (1pt);
\fill (P5) circle (1pt);
\fill (P6) circle (1pt);
\fill (P7) circle (1pt);
%先頭の自由流
\draw[thick, ->] (P0)--(P2);
%おしり
\draw[thick, ->] (P3)--(P4);
\draw[thick, ->] (P4)--(P5);
\draw[thick, ->] (P5)--(P6);
\draw[thick, ->] (P6)--(P7);
%shockwave
\draw[dashed, -, red] (P1)--(P4);
\draw[dashed, -, blue] (P2)--(P6);
%
%渋滞長さ
\draw[thick, <->, red] (29/3,2)--(P4);
\draw[thick, <->, blue] (35/3,4)--(P6);
%交通状態
\coordinate [label=center:{\textcircled{\scriptsize 0}}] (S0) at (11,1);
\coordinate [label=center:{\textcircled{\scriptsize 1}}] (S1) at (8,1);
\coordinate [label=center:{\textcircled{\scriptsize 2}}] (S2) at (9,1.8);
\coordinate [label=center:{\textcircled{\scriptsize 3}}] (S3) at (10,3);
\coordinate [label=center:{\textcircled{\scriptsize 4}}] (S4) at (11, 3.7);
\coordinate [label=center:{\textcircled{\scriptsize 5}}] (S5) at (12,4.3);
%
\fill (S0) circle (0pt);
\fill (S1) circle (0pt);
\fill (S2) circle (0pt);
\fill (S3) circle (0pt);
\fill (S4) circle (0pt);
\fill (S5) circle (0pt);
\end{scope}
\end{tikzpicture}
\caption{Time-Space図}
\label{Time-Space図}
\end{figure}